Member-only story
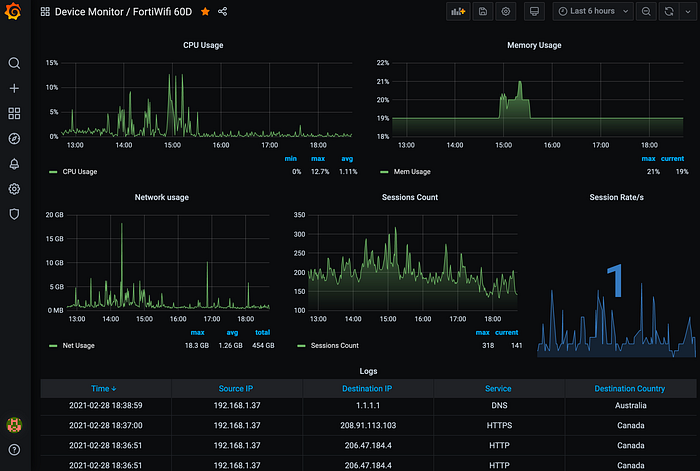
In the pandemics epoch, it is easy to get bored, but it is in time like these that creative ideas raise to make lifetime changes. Unfortunately, I haven’t got one, so I wrote this article describing how to collect metrics and logs from Fortinet devices in a centralized, useful, and more appealing way.

Why ?
Moving to my last house, I found the home router with a horrible Wi-Fi signal, so I decided to undust my FortiWifi 60D (Thanks R.F. :-). After setting up the basics I felt a sensation in my guts, which it result to be a need to “Grafanize” performance and logs on my rpi.
What ?
In real enterprise scenarios, it is vital to keep all core devices monitored and the traffic supervised, but, in my domestic environment, play with logs or try to find out why my Netflix streaming slow down is what I would make the most of. As usual, there are different approaches but this was my little journey.
How ?
Collecting performance metrics via SNMP and Syslogs via rsyslogd. The TIG stack (Telegraf, InfluxDB, and Grafana) running on containers will parse, store and finally display our data.
Minimum requirements:
- Docker
- SNMP/MIBs (Fortinet provide their proprietary MIBs downloadable via the device GUI)
- Rsyslog (needed for my case due to RFC incompatibility of Fortigate OS)
- Fortinet device (but could potentially be any other with the same outputting)
Let´s begin with the host setup:
I used a raspberry pi 3 to deploy the monitoring solution, in a tiny house a cigarette package size server, fit just perfect.
Under the /etc/rsyslog.conf file uncomment below configuration bit to enable rsyslog listening for remote inputs on default port 514 for TCP/UDP :
# provides UDP syslog reception
module(load="imudp")
input(type="imudp" port="514")
# provides TCP syslog reception
module(load="imtcp")
input(type="imtcp" port="514")
Add the configuration to redirect all the logs to a dedicated file instead of the main syslog file, I use the hostname as a filter but you…
